Team Report
The Team Report delivers immediate insights to help you unleash the power of your team. This is the basis for all TeamLytica interventions.
Team Reports
Immediate insights to help you unleash the power of your team.
The basis for all TeamLytica interventions.
What is a Team Report?
On the team by the team - A simple, effective and powerful tool to help you, help your client teams improve their performance.
Built by managers, for managers, Complements psychometrics - adding a new tool to your tool box that's practical, pragmatic and action-focused.
Designed to deliver ROI - build longer-term client relationships by offering re-tests to demonstrate measurable improvements.
Built different - adding USPs to your coaching or training business that sets you apart from your peers.
Immediate Actionable Data and Insights
Immediate Actionable Data and Insights
A complete set of data and commentary allowing you to understand and get the very best from your team

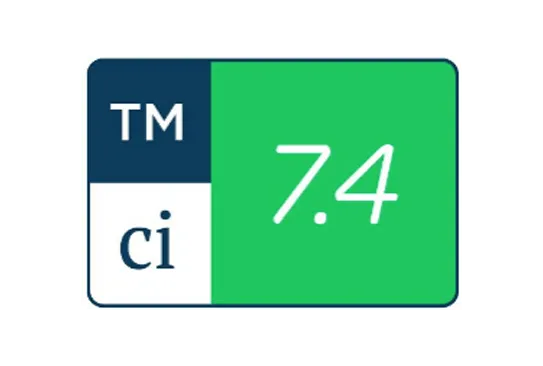
Cohesion Index
Clever algorithms generate an overall score for the team of it's operational 'health'.

Stress Indicator
A powerful and unique metric that correlates team wellbeing and productivity.

Morale Indicator
An indication of team morale that will help guide your support and development.

Category and Questions Scores
All scored and colour-coded Green, Amber and Red for ease of use and comparisons.

Disparity Reports
Learn the detail behind the scores to help build team cohesion.

Open Text
Comments
Direct from the team - positives, weaknesses and suggestions to improve.

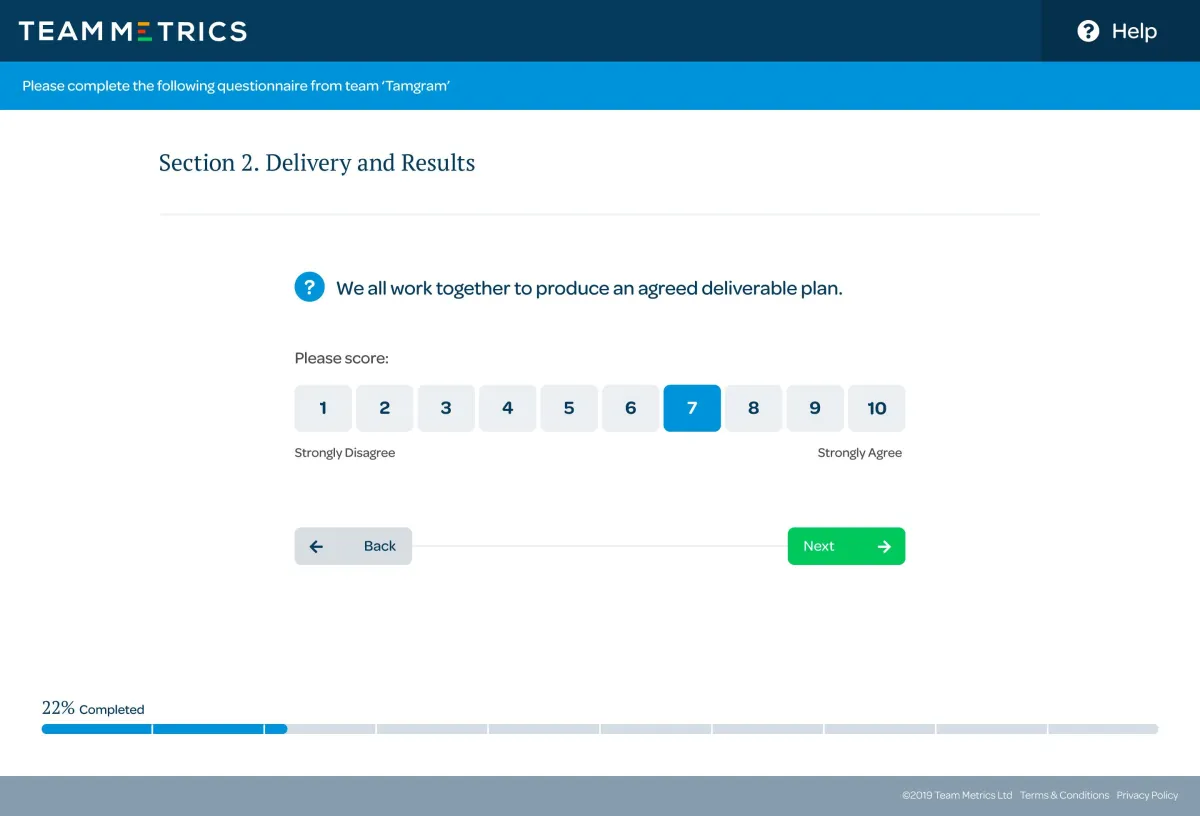
Simple and Easy Setup
On the team by the team - 54 questions that every team member completes on how the team works and functions together.
The system is automated and is simple to set up and manage.
It takes about twenty minutes to complete and all responses are completely confidential. There are NO individuals within the report.
The report is accessed through an interactive dashboard which also generates a 28 page pdf report on the team.
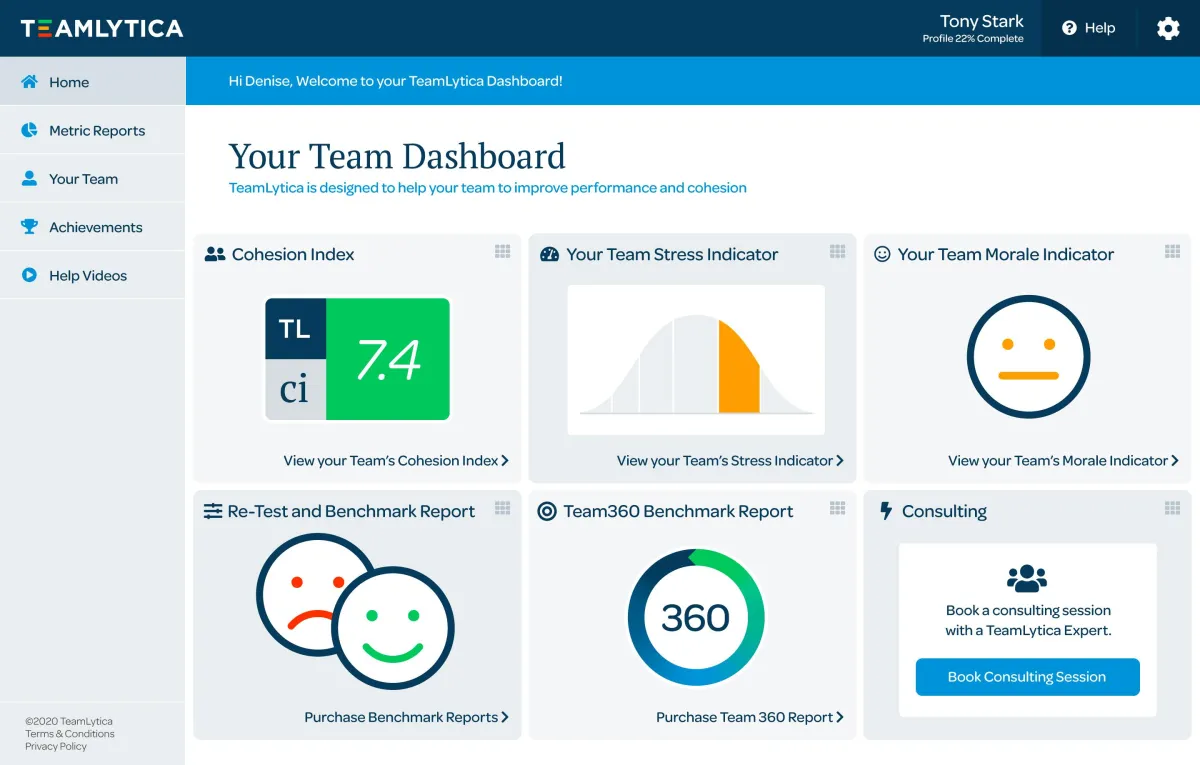
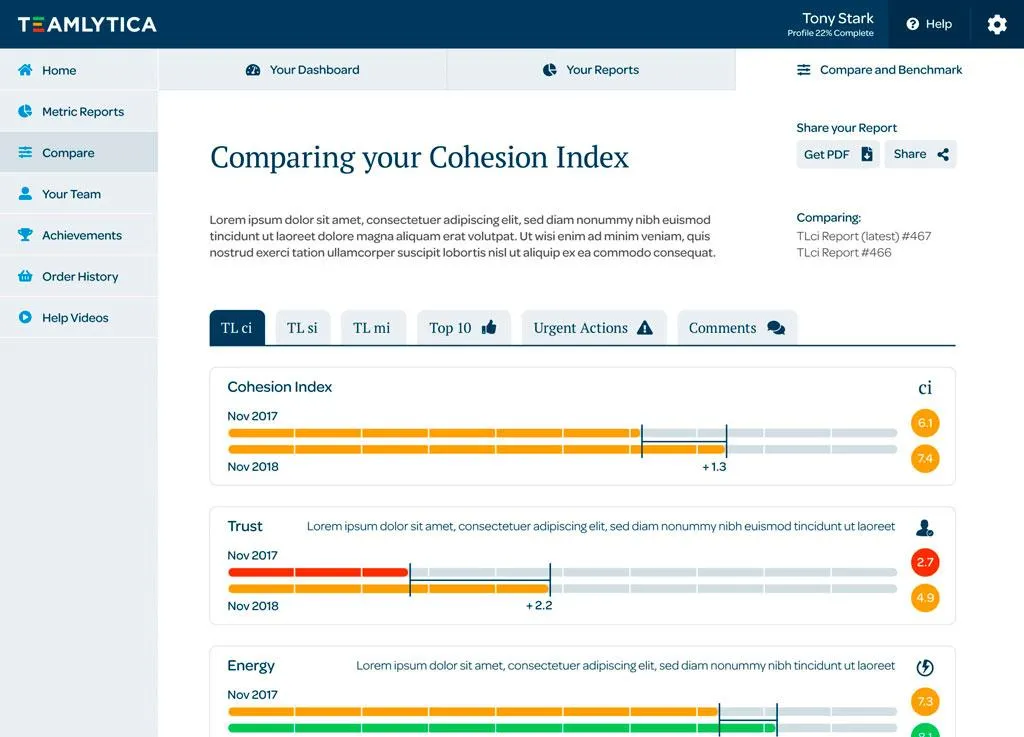
Powerful Dashboards
Your TeamLytica dashboard has everything you need within just a few clicks. It's accessible by you, the coach, and the team manager.
It's simple to navigate and find the details you need to help the team improve. Every metric is clearly laid out and easily understood so as to make action-planning as simply as possible.
We always recommending sharing the dashboard with the whole team as it's their scoring and comments that power the outputs. By sharing you will encourage transparency and ownership of the challenges and pathways ahead.
Unique Metrics
TeamLytica is all about measuring team behaviours and performance. Your interventions, through coaching, observations, nudging and training can move the performance dial.
Purposely Different - built on practicalities and real-world experience rather than a more academic approach.
Bringing the team along - aligning goals, behaviours and actions to increase team outputs - it's their data.
K.I.S.S.
Keep It Simple, Stupid.
The User Experience, from team member, manager or associate is simple, clean and easy to navigate.
It's quick and fun to complete - accessible to every employee level.
We don't ask questions in multiple different ways to try and validate responses - every question has a purpose and approach.
Results are easily understood, with Red, Amber, Green scoring so everyone in the team can visually see how the team works together.

Team Stress Scores
Selected scores are extracted and compiled to form the Team Stress Curve. This will give you a strong indication of how stressed the team feels. The chart goes from Apathy on the far left to burnout on the far right.
All teams need some stress in the work they carry out. The optimum performance is found in the middle of the curve where a good balance is met.

Immediately Useful
'Within 20 minutes of introducing the team to TeamLytica, we were making positive changes to how we operated'.
TeamLytica will tell you what's working well, and what's not - all generated by the people who know best - the team members.
The RAG scores will guide actions and your support to which areas the team needs to focus on to move the performance dial.
Focused actions will demonstrate to the team that their feedback counts and progress can be made.
Longer-Term Support
Build longer-term client relationships with tools that will help you go deeper, wider and further in supporting teams and managers.
Measure everything - presented back via the dashboard
Create and Prioritise actions - Build a plan -RAG scores and KPIs
Implement - weave your magic - train and coach coach
Re-assess - Benchmark report to measure progress and prove ROI
Team Morale
A team that enjoys good morale is almost always more productive than those that don’t.
We provide a visual indication of the morale within your team to give you a good steer on where work needs to done or otherwise to boost team performance.
Anecdotal Feedback
Metrics and scores are one thing but, you can't beat actionable feedback. We ask the team three simple questions so as to share their thoughts - it usually provides a goldmine of content for you.
What's working well? - If it's working and the team like it, let's encourage them to do more.
What needs to improve? - the team knows where improvements can be made. Act upon these gems to move the performance dial.
Three quick wins? - Acting upon feedback and suggestions will align and motivate the team and deliver huge dividends.
Disparity Scores
The report is only based on team scores and an individual and their marks can never be identified. However, what we do include for the manager and their team is how each score is made up. We show a visual representation of how the final score was achieved.
The graph beneath each score will reveal how many of each score was given. For example, it might show 2 x threes, a four, 3 fives, 4 sevens and 2 eights.
Weave Your Magic
A TeamLytica report will give you heaps of information - both score based and anecdotal - to help move the team forward. However, we don't prescribe how you should approach this as every team is different.
We want you weave your own magic by utilising all those years of experience, expertise and knowledge you've built up to help the team. That's the fun part - we're here to help if you need some guidance but, you'll usually know what to do.
Simple and Easy Setup
On the team by the team - 54 questions that every team member completes on how the team works and functions together.
The system is automated and is simple to set up and manage.
It takes about twenty minutes to complete and all responses are completely confidential. There are NO individuals within the report.
The report is accessed through an interactive dashboard which also generates a 28 page pdf report on the team.
Powerful Dashboards
Your TeamLytica dashboard has everything you need within just a few clicks. It's accessible by you, the coach, and the team manager.
It's simple to navigate and find the details you need to help the team improve. Every metric is clearly laid out and easily understood so as to make action-planning as simply as possible.
We always recommending sharing the dashboard with the whole team as it's their scoring and comments that power the outputs. By sharing you will encourage transparency and ownership of the challenges and pathways ahead.
Powerful Dashboards
Manage your priorities – whether you manage a single team, an area, region or entire company, our powerful dashboards and data filters allow you to understand your teams strengths, how stressed they feel and their overall morale. Drill in further to category summaries and individual question scores – all colour-coded for ease of use.
Unique Metrics
TeamLytica is all about measuring team behaviours and performance. Your interventions, through coaching, observations, nudging and training can move the performance dial.
Purposely Different - built on practicalities and real-world experience rather than a more academic approach.
Bringing the team along - aligning goals, behaviours and actions to increase team outputs - it's their data.
K.I.S.S. Keep It Simple, Stupid.
The User Experience, from team member, manager or associate is simple, clean and easy to navigate.
It's quick and fun to complete - accessible to every employee level.
We don't ask questions in multiple different ways to try and validate responses - every question has a purpose and approach.
Results are easily understood, with Red, Amber, Green scoring so everyone in the team can visually see how the team works together.
Team Stress Scores
Selected scores are extracted and compiled to form the Team Stress Curve. This will give you a strong indication of how stressed the team feels. The chart goes from Apathy on the far left to burnout on the far right.
All teams need some stress in the work they carry out. The optimum performance is found in the middle of the curve where a good balance is met.
Immediately Useful
'Within 20 minutes of introducing the team to TeamLytica, we were making positive changes to how we operated'.
TeamLytica will tell you what's working well, and what's not - all generated by the people who know best - the team members.
The RAG scores will guide actions and your support to which areas the team needs to focus on to move the performance dial.
Focused actions will demonstrate to the team that their feedback counts and progress can be made.
Longer-Term Support
Build longer-term client relationships with tools that will help you go deeper, wider and further in supporting teams and managers.
Measure everything - presented back via the dashboard
Create and Prioritise actions - Build a plan -RAG scores and KPIs
Implement - weave your magic - train and coach coach
Re-assess - Benchmark report to measure progress and prove ROI
Team Morale
A team that enjoys good morale is almost always more productive than those that don’t.
We provide a visual indication of the morale within your team to give you a good steer on where work needs to done or otherwise to boost team performance.
Anecdotal Feedback
Metrics and scores are one thing but, you can't beat actionable feedback. We ask the team three simple questions so as to share their thoughts - it usually provides a goldmine of content for you.
What's working well? - If it's working and the team like it, let's encourage them to do more.
What needs to improve? - the team knows where improvements can be made. Act upon these gems to move the performance dial.
Three quick wins? - Acting upon feedback and suggestions will align and motivate the team and deliver huge dividends.
Disparity Scores
The report is only based on team scores and an individual and their marks can never be identified. However, what we do include for the manager and their team is how each score is made up. We show a visual representation of how the final score was achieved.
The graph beneath each score will reveal how many of each score was given. For example, it might show 2 x threes, a four, 3 fives, 4 sevens and 2 eights.
Weave Your Magic
A TeamLytica report will give you heaps of information - both score based and anecdotal - to help move the team forward. However, we don't prescribe how you should approach this as every team is different.
We want you weave your own magic by utilising all those years of experience, expertise and knowledge you've built up to help the team. That's the fun part - we're here to help if you need some guidance but, you'll usually know what to do.

Tyrelle Mcleod-Bentley
Director
Soccer Assist
The irony is not lost on us that we recruit and place the next generation of sports stars who all have to excel in teams. The Teamlytica platform has helped us get to a place where we're proud of our own team performances.

Anita Dev
Director
TeamWork ADL
The team reports have really helped our team and given our senior leaders the knowledge we've needed to make effective changes to the way we work and manage.

Steve Chown
Entrepreneurial Innovation Manager
TeamLytica's software has been identified as a valuable tool to check the effectiveness of newly combined teams in the Bank. We are using it to review their progress as the staff becomes more integrated.
Tyrelle Mcleod-Bentley
Director
Soccer Assist
The irony is not lost on us that we recruit and place the next generation of sports stars who all have to excel in teams. The Teamlytica platform has helped us get to a place where we're proud of our own team performances.
Anita Dev
Director
TeamWork ADL
The team reports have really helped our team and given our senior leaders the knowledge we've needed to make effective changes to the way we work and manage.
Steve Chown
Entrepreneurial Innovation Manager
TeamLytica's software has been identified as a valuable tool to check the effectiveness of newly combined teams in the Bank. We are using it to review their progress as the staff becomes more integrated.
Accredited Coaches
Only accredited coaches can use TeamLytica.
The training and support you get will ensure you have the right level of knowledge to be able to coach teams as well as individuals. Then our reporting platform gives you a strong structure, providing you with a foundation that you can build on with your own knowledge and experience.
Find out more about our solution:
Keep up to date with our
News & Blogs

Public Sector
Public Sector
Boosting teamwork and performance is challenging when budgets are being squeezed.
If you are a manager in the public sector, you face a variety of pressing challenges. The world is volatile, uncertain and ambiguous: it’s not often clear what the future holds for specific departments or processes. What’s more, technology is changing the nature of public services, reducing staffing requirements and increasing the technical complexity of the work.
Public sector teams need to be able to deliver services to the general public effectively. Dysfunctional groups create internal problems and don’t provide a level of service that taxpayers expect. Many problems begin at the team level, which is why rooting them out and fixing them is so important.
TeamLytica is a tool that does just that. It delves into the management issues that could be affecting the performance and wellbeing of your team and offers solutions to resolve them.
Using KITE – K – Knowledge, I – Insights, T – Training, E – Empowerment.
The platform uses a confidential questionnaire. Managers send a survey to their colleagues covering nine domains critical for describing the success of the team. Employees then upload their answers to the platform that automatically generates a 28-page report based on the data provided.
The report contains all kinds of valuable insights that enable you to identify issues which might be hampering the effectiveness of your team. Think of it as a diagnostic tool – a way of sniffing out problems that would otherwise be challenging to observe.
The Team Overview page provides an executive summary of team and management performance across nine critical factors: leadership, delivery, trust, capability, energy, harmony, stakeholders, accountability and resilience. You can immediately get a feel for the nature and extent of the problems afflicting your department and take actions to address them.
We aim to do things a little differently at TeamLytica – we’re here to help.
Management in the public sector is difficult; complicated partly by the high levels of unionisation. With TeamLytica, you get a range of simple, actionable steps you can take immediately, based on the findings of the survey. Key development areas could include things like helping new leaders find their feet, better communicating with employees, and training and development options to enhance the effectiveness of leaders.
What about differences in performance between teams in different departments? TeamLytica can help with that too.
Many managers in the public sector often wonder why some teams perform better than others. The TeamLytica platform provides tools that allow you to compare various departments to one another and find the metrics that might explain performance differentials. One team, for instance, might have a high level of trust in management and feel confident with reporting problems; another might not.
Public sector departments also rely heavily on a select few “star” employees: people with the knowledge and expertise to keep the show running. TeamLytica allows you to important key performance metrics and cross-correlate them with employee satisfaction measures from the survey. You’re then immediately able to see whether you’re at risk of losing your most valuable people and adopting management strategies to address this.
The public sector faces management challenges from a changing workforce to people empowerment. It’s vital, therefore, that you use TeamLytica’s tools to uncover the problems holding your team back so that you can continue to deliver to the public.